Reverse engineering, also called backwards engineering or back engineering, is the process by which an artificial object is deconstructed to reveal its designs, architecture, code, or to extract knowledge from the object. It is similar to scientific research, the only difference being that scientific research is conducted into a natural phenomenon. - Wikipedia
I was reading a book about RE (https://0xinfection.xyz/reversing/) and I tried simplifying it
Alrightyy lets see what it said:
Two basic techniques- Static analysis uses software tools to examine the executable without running the actual decompiled instructions in Assembly.
- Dynamic analysis uses disassemblers and debuggers to analyze malware binaries while actually running them.
Types of malware- Backdoor: Hidden malware that gives attackers unauthorized remote access to a system.
- Botnet: Network of infected computers controlled centrally via a command-and-control server.
- Downloader: Malware designed to install additional malicious software after initial system access.
- Advanced malware (like rootkits) hides itself and other threats, making detection extremely difficult.
- Scareware tricks users into paying for fake security, while some malware spreads spam for attacker profit.
- Worms and viruses replicate themselves and spread to infect other systems.
Assembly introduction- x86 Assembly is a backward-compatible family of low-level languages for Intel processors, using mnemonics for CPU instructions.
- Two syntaxes exist:AT&T (source → destination)
Intel (destination → source) more commonly used
Data Sizes- Byte 1 byte (8 bits)
- Word 2 bytes (16 bits)
- Double Word (DWORD) 4 bytes (32 bits)
- Quad Word (QWORD) 8 bytes (64 bits)
Architecture- CPU consists of:
- Control Unit: Fetches and decodes instructions, manages data flow between CPU and memory.
- Execution Unit: Performs the actual operations and executes instructions.
- Registers: storage inside CPU for temporary data.
- Flags: Status indicators that show results of operations (e.g., zero, carry).
- A 32-bit CPU reads 4 bytes (one instruction) from memory at a time. It decodes the bits and executes the instruction. After execution, it moves to the next instruction in memory.
- EIP (Instruction Pointer) stores address of the next instruction. If manipulated, attackers can change program behavior. The whole process runs based on the system clock timing.
Types of registers- General-purpose registers: Store temporary data and perform operations (e.g., EAX, EBX).
- Segment registers: Hold memory segment addresses (e.g., CS, DS).
- Instruction Pointer (EIP): Points to the next instruction to execute.
- Control registers: Manage CPU behavior and system control (e.g., CR0).
General-purpose registers:- EAX (Accumulator)
Description: Used in arithmetic calculations; holds results and return values
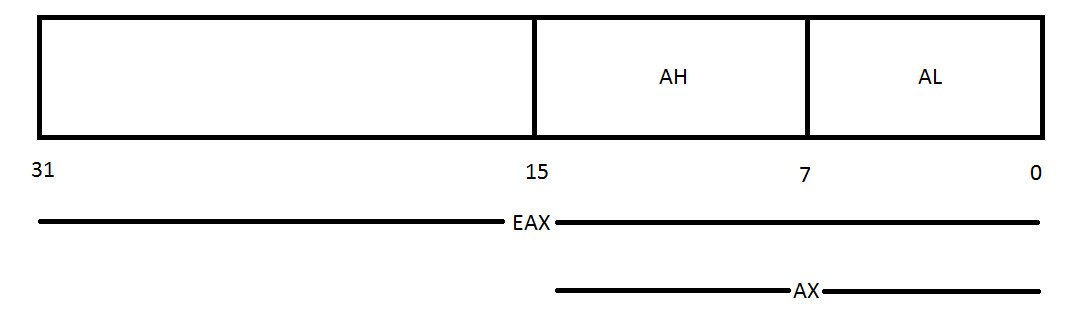
16-bit: AX
High 8-bit: AH
Low 8-bit: AL - EBX (Base Register)
Description: Pointer to data in DS segment; stores base address
16-bit: BX
High 8-bit: BH
Low 8-bit: BL - ECX (Counter Register)
Description: Holds loop count; used in loops and string operations
16-bit: CX
High 8-bit: CH
Low 8-bit: CL - EDX (Data Register)
Description: General purpose; used in I/O; extends EAX to 64-bit
16-bit: DX
High 8-bit: DH
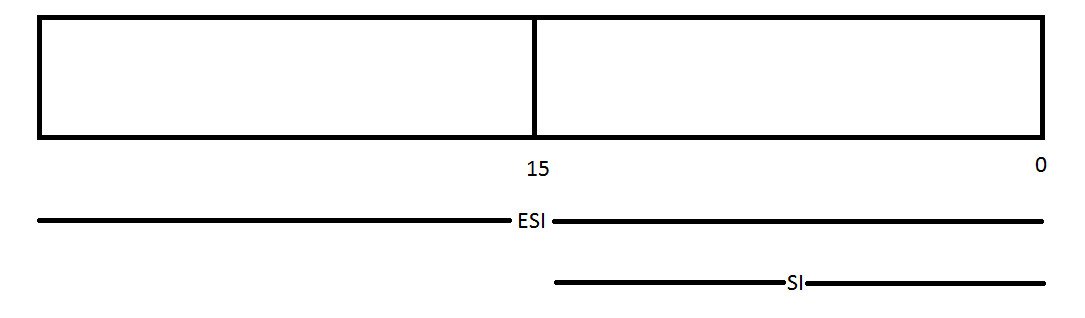
Low 8-bit: DL - ESI (Source Index Register)
Description: Points to data in DS; used in string/array operations (read address)
16-bit: SI
High 8-bit: -
Low 8-bit: - - EDI (Destination Index Register)
Description: Points to destination in ES; used in string/array operations (write address)
16-bit: DI
High 8-bit: -
Low 8-bit: - - EBP (Base Pointer)
Description: Points to stack (SS); bottom of current stack frame; used for local variables
16-bit: BP
High 8-bit: -
Low 8-bit: - - ESP (Stack Pointer)
Description: Points to top of stack (SS); used for stack operations and local variables
16-bit: SP
High 8-bit: -
Low 8-bit: - - All registers are 32-bit (4 bytes). Some registers can be accessed in smaller parts (16-bit and 8-bit). First group can be split into 16-bit → then 8-bit (high/low). Second group can only be split into 16-bit (no 8-bit parts).
- Examples:
Segment Registers
- CS (Code Segment Register)
Description: Stores base location of code (.text); works with EIP to fetch instructions; cannot be directly modified - DS (Data Segment Register)
Description: Stores default location for variables (.data); used for data access - ES (Extra Segment Register)
Description: Used in string operations and additional data handling - SS (Stack Segment Register)
Description: Stores base location of stack; used with ESP/EBP for stack operations - FS (Extra Segment Register)
Description: Points to additional data segments; used for special purposes like thread data - GS (Extra Segment Register)
Description: Points to additional data segments; used for system/thread-specific data - Each segment register is 16-bits
- Segment registers are controlled by the OS and usually cannot be read or modified by programs.
- In 32-bit (protected mode), each program gets a 4GB address space. A register can address up to 4,294,967,296 memory locations (2³²). Even if physical RAM > 4GB, the OS maps only a 4GB region per program.
- Segment registers help the OS manage and protect memory regions.
Hacking the EIP- Program idea: A hidden function (unreachableFunction) exists but is never called → normally only "Hello World!" runs.
c#include
#include
void unreachableFunction(void){
printf("I'm hacked! I am a hidden function!\n");
exit(0);
}
int main(void){
printf("Hello World!\n");
return 0;
}
- Compile & run (32-bit with debug):
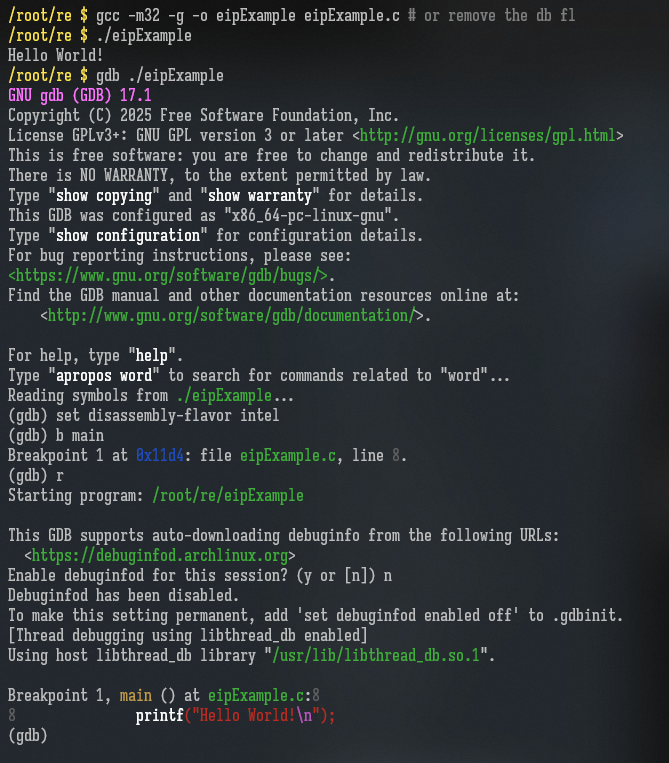
bashgcc -m32 -gdb -o eipExample eipExample.c # or remove the db flag
./eipExample # hello world
- Start debugging with GDB:
bashgdb ./eipExample
set disassembly-flavor intel # intel cpus
b main # set a breakpoint at main "=>" will be shown at main's address
r # run? (or just see the breakpoint?)
- Disassemble main (see instructions + EIP flow):
bashdisas
- Check where EIP is pointing:
bashx/1xb $eip
x/1xw $eip # this is where the main function is pointing
- Find address of hidden function:
bashdisas unreachableFunction # now disasssemble the hidden function
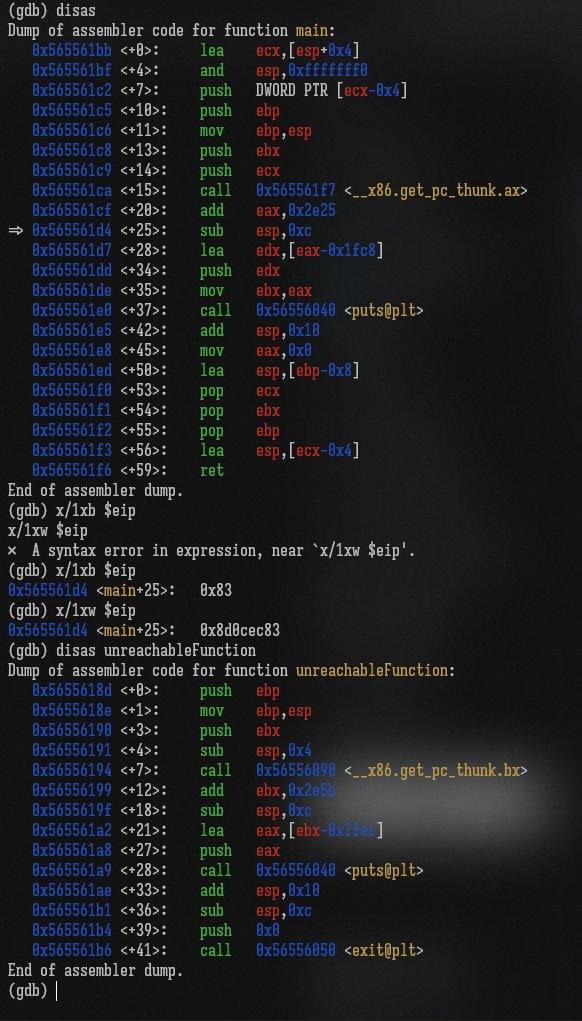
- Hijack execution (change EIP):
bashset $eip = 0x0804843b # the first address in the list
x/1xw $eip # set execution point to address of the function
bashc
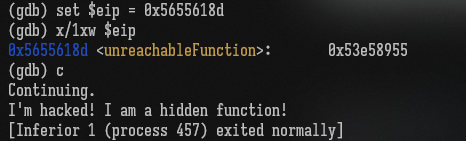
- EIP controls next instruction execution, Changing EIP = full control of program flow, This is how exploits redirect execution to hidden/malicious code
Control Registers- CR0 (Control Register)
Description: Controls operating mode and processor states - CR1 (Control Register)
Description: Not implemented - CR2 (Control Register)
Description: Stores page fault information - CR3 (Control Register)
Description: Holds page directory information - CR4 (Control Register)
Description: Contains flags to enable processor features and capabilities - Values cannot be accessed directly, must go through general-purpose registers.
- Used mainly in low-level system programming (OS/kernel). Normal programs rarely modify, but may read flags for CPU capabilities. Changing these registers can affect memory management and execution modes.
Flags- CF (Carry Flag)
Type: Status flag
Description: Set when an unsigned operation produces carry/borrow - PF (Parity Flag)
Type: Status flag
Description: Set if result has even number of 1 bits - AF (Adjust Flag)
Type: Status flag
Description: Set if carry/borrow occurs from bit 3 (BCD operations) - ZF (Zero Flag)
Type: Status flag
Description: Set if result is zero - SF (Sign Flag)
Type: Status flag
Description: Indicates sign of result (MSB) - OF (Overflow Flag)
Type: Status flag
Description: Set if signed result overflows register range - DF (Direction Flag)
Type: Control flag
Description: Controls increment/decrement in string operations - TF (Trap Flag)
Type: System flag
Description: Enables single-step debugging - IF (Interrupt Enable Flag)
Type: System flag
Description: Enables/disables external interrupts - IOPL (I/O Privilege Level)
Type: System flag
Description: Defines I/O privilege level of task - NT (Nested Task Flag)
Type: System flag
Description: Indicates linked tasks - RF (Resume Flag)
Type: System flag
Description: Controls exception handling in debugging - VM (Virtual-8086 Mode Flag)
Type: System flag
Description: Indicates virtual-8086 mode - AC (Alignment Check Flag)
Type: System flag
Description: Enables alignment checking - VIF (Virtual Interrupt Flag)
Type: System flag
Description: Virtual interrupt flag in VM mode - VIP (Virtual Interrupt Pending)
Type: System flag
Description: Indicates pending virtual interrupt - ID (Identification Flag)
Type: System flag
Description: Indicates CPUID support - Flags help determine if an operation was successful, zero, overflowed, or invalid. Essential in assembly for conditional branching and debugging.
Stack- The stack is a contiguous memory region used during program execution.
- ESP (Stack Pointer) points to the top of the stack (smallest valid address). Addresses below ESP = garbage, above ESP = valid stack data.
- Stack grows DOWNWARD (higher → lower memory). Example: Before call → ESP = 0xffffd050, After call → ESP = 0xffffd030 (decreased → stack grew)

- Stack bottom: highest address (top of memory).
- Stack limit: lowest valid address (crossing it → stack overflow).
- Push: decreases ESP, adds data to stack.
- Pop: increases ESP, removes data from stack.
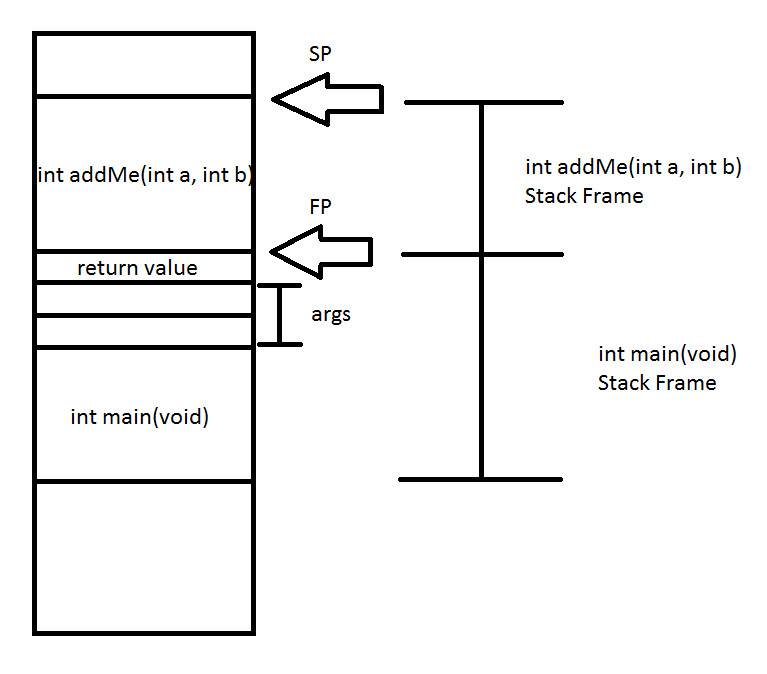
- Program: main() calls addMe(2,3)
- Step 1 (before call): main stack frame exists, Arguments (2,3) pushed onto stack, Space reserved for return value
- Step 2 (function call): Control jumps to addMe, New stack frame created
- Step 3 (inside addMe): FP frame pointer (EBP) → fixed reference point, SP stack pointer (ESP) → moves for local variables, Arguments accessed via fixed offsets from FP
- Step 4 (return): Result (a+b) stored, ESP reset to EBP → stack frame removed, Control returns to main
- ESP changes frequently, EBP stays fixed, used for accessing args + locals
- Each function has its own stack frame
hea
- Stack grows downward, heap grows upward.
- Heap is a large, flexible memory region not automatically managed like the stack.
- Allocation:Use malloc() / calloc() / realloc()
Must manually free using free() - Memory leak: If not freed, memory stays reserved and unusable.
- No fixed limit like stack, only limited by system memory.
- Slower than stack (access via pointers).
- Heap variables are accessible globally across functions.
- Use cases: Large data (arrays, structs), Dynamic size (grow/shrink), Long lifetime variables
vi- i: insert mode
- esc: command mode
- j/↓: down
- k/↑: up
- h/←: left
- l/→: right
- 0: start of line
- $: end of line
- b: prev word start
- dd: delete line
- D: delete to end
- yy: copy line
- p: paste
- u: undo
- :w: save
- :wq: save+exit
- :q!: exit no save
We will continue with further assembly in next articles, but if you would like to continue on your own pace, here's the book i took notes from: https://0xinfection.xyz/reversing/ by @mytechnotalentI further plan to break down some crackmes and create articles
<3

follow me on x dot com for more
original x article: https://x.com/forloopcodes/status/2034315670020837482